Overview
Boston Consulting Group (BCG) is a global consulting firm at the forefront of Business Strategy that partners with leaders in business, government and society to tackle their most important challenges and identify opportunities. BCG chose Velocita as its creative partner for report designing.
Case Timeline
2018 – 2019
Brand
BCG | Report design, Brochure design
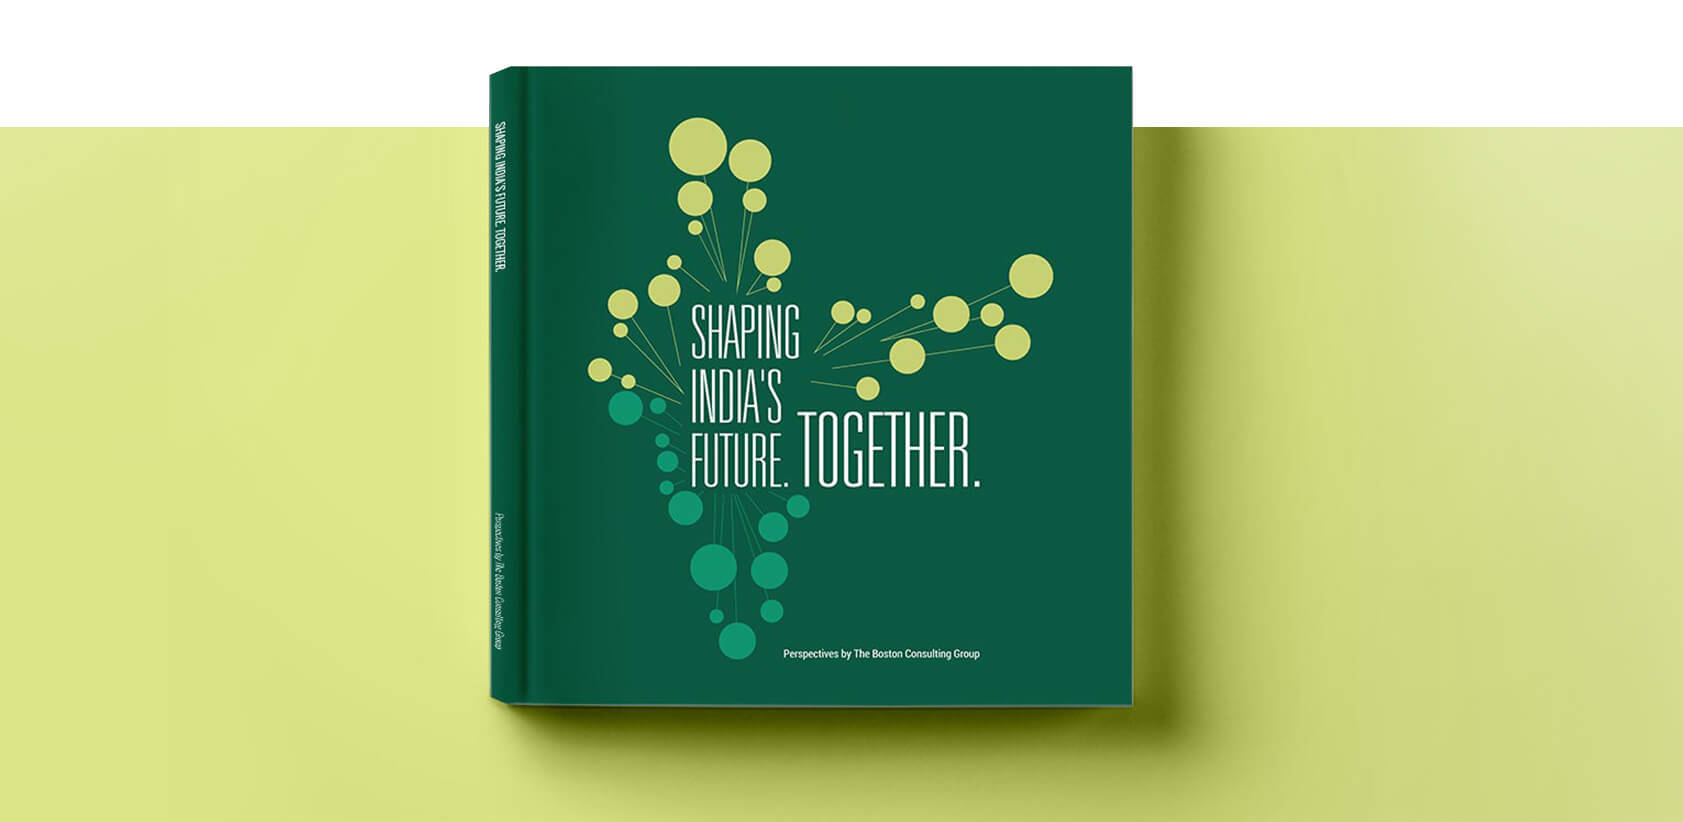
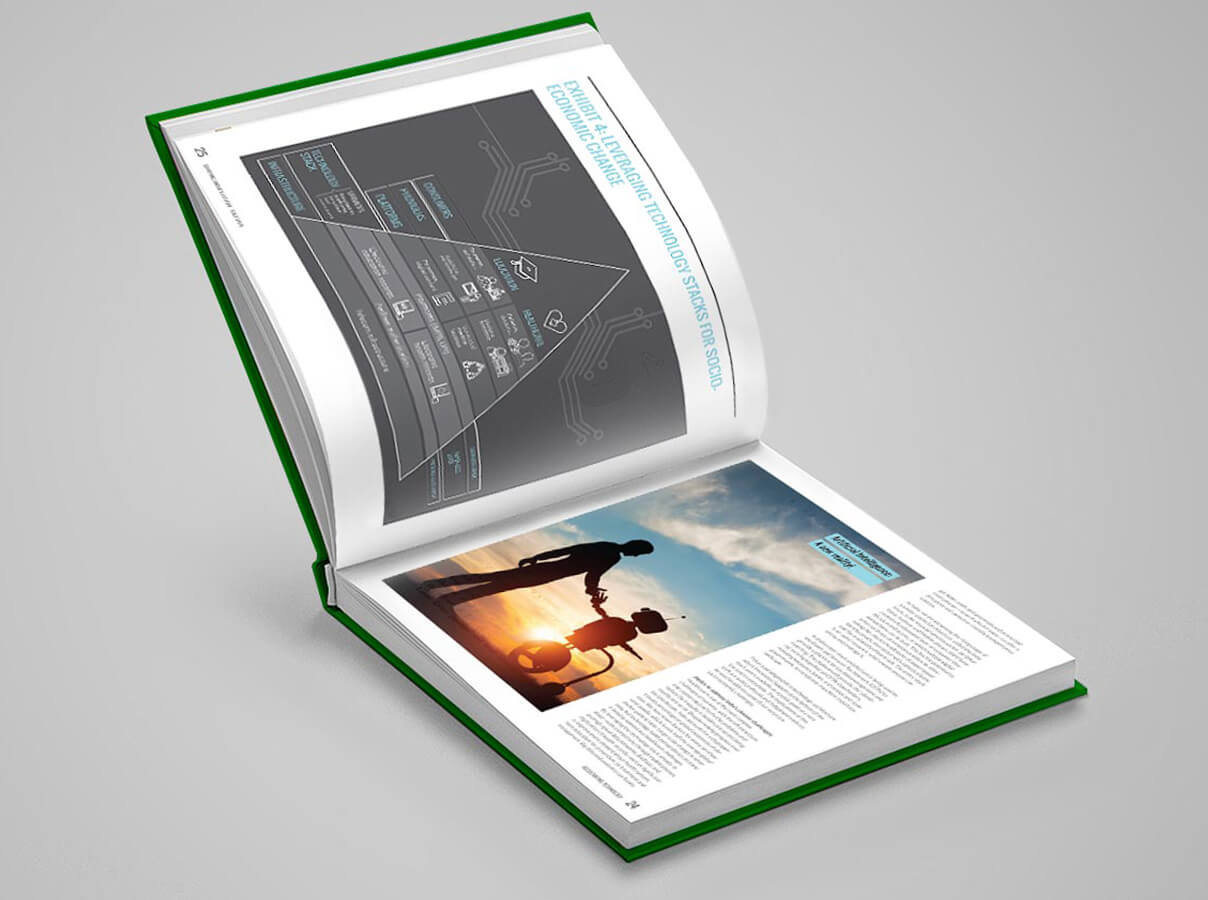
Shaping India’s Future. Together.
When a company like BCG that is internationally acclaimed for its work in management consulting and business strategy prepares a comprehensive report or roadmap to shape India’s future, it is only natural the brochure design expectations are high.
The brochure layout and design focused on the five megatrends affecting India for the next 20 years. We designed it in a way for these to come together, coupling vibrant images with the detailed reports of essays on each trend. The design concept is based on the circles in a dialogue box or an idea cloud, that is the main design element used to create the India map on the cover.
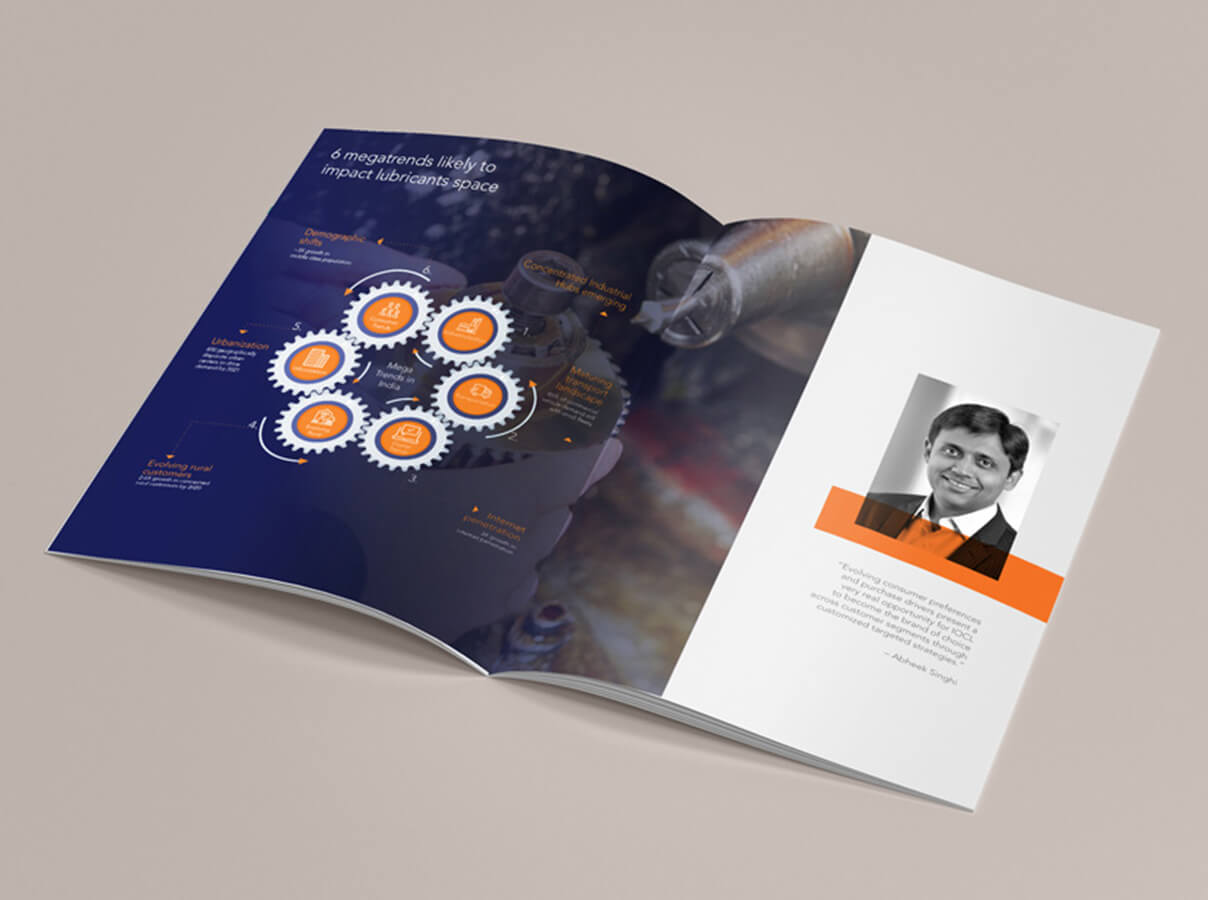
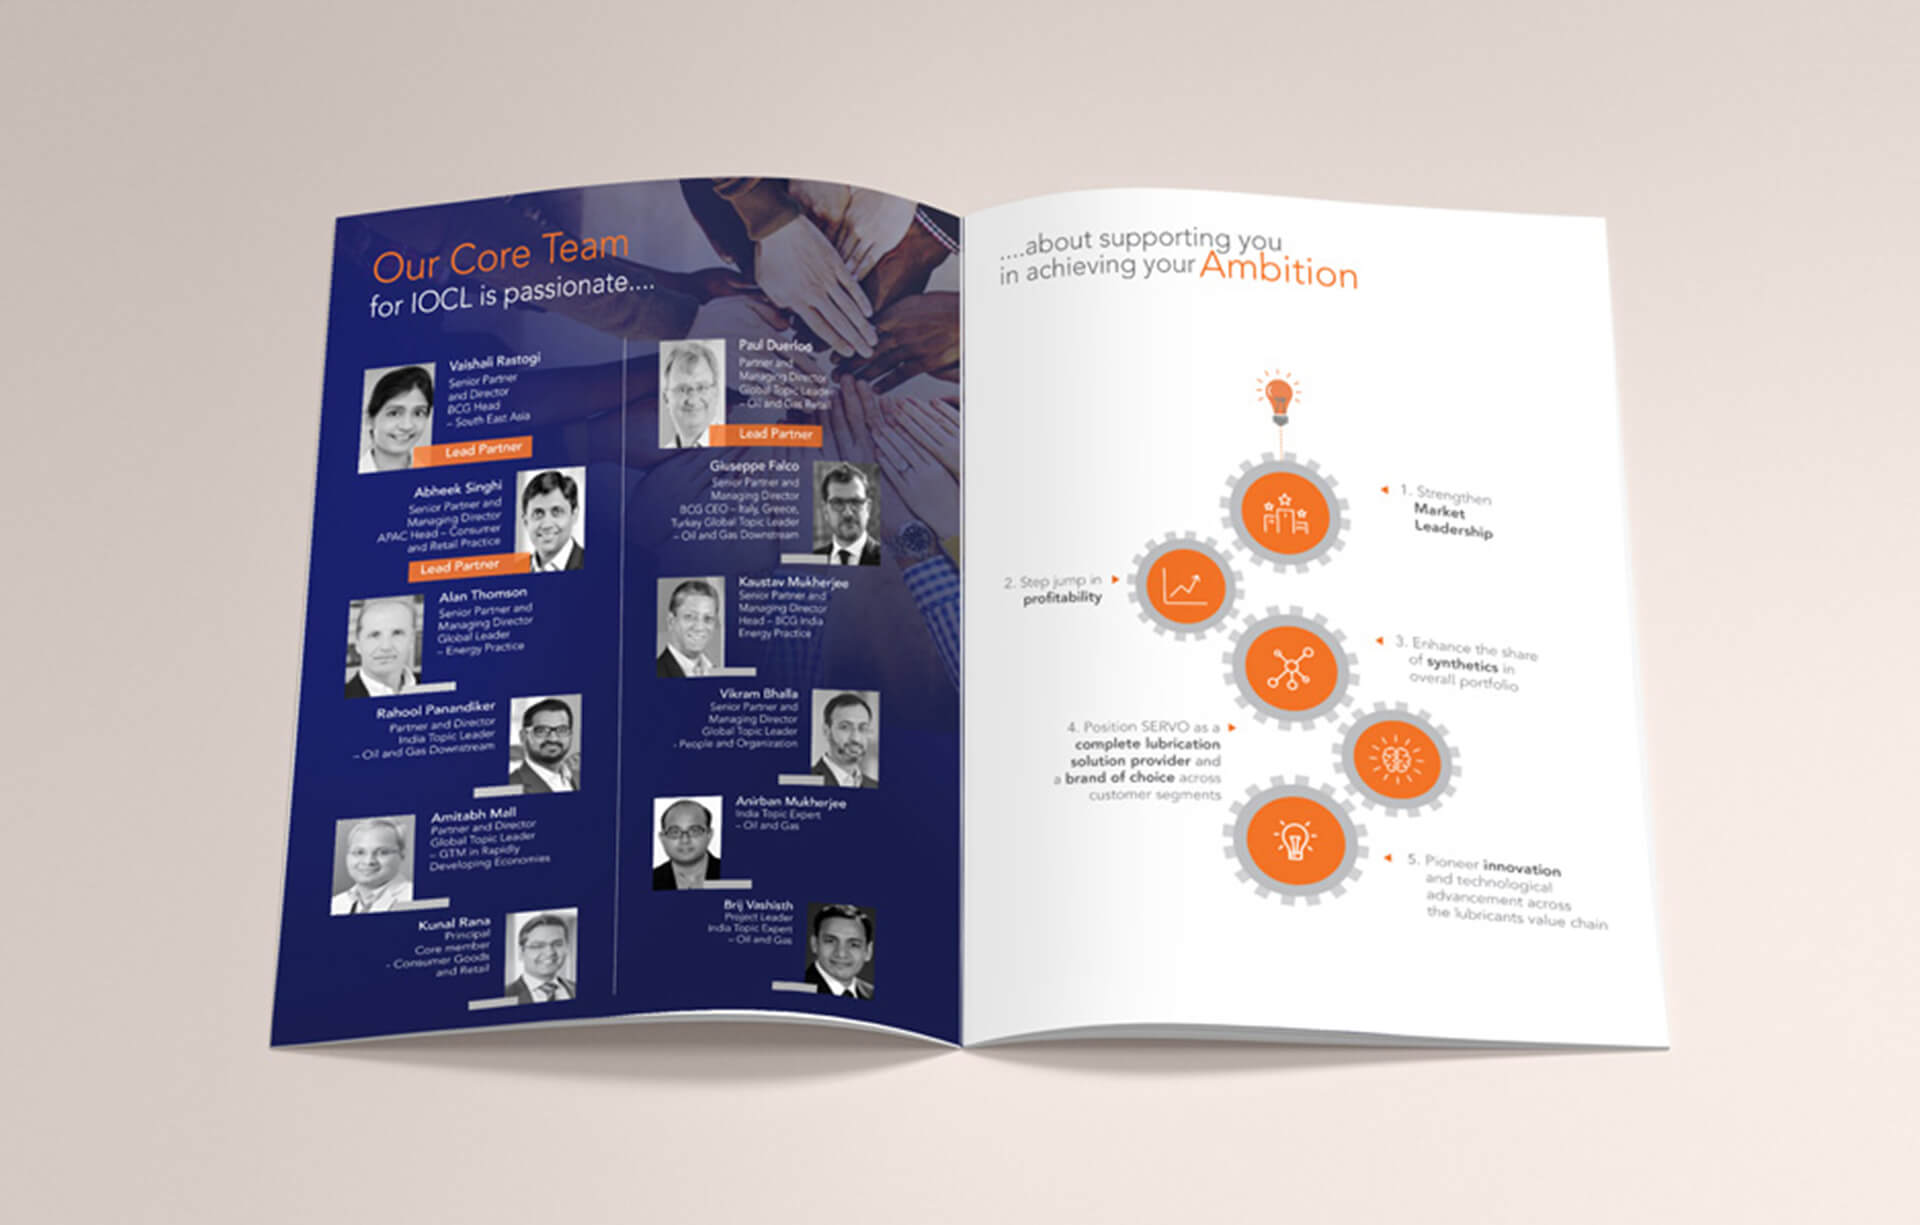
IOCL lubricant market report
BCG partnered with IOCL- India’s flagship National Oil Company, for its Route-to-Market strategy for its lubricants business. As a show of thought leadership and domain knowledge in the space, BCG put together a binder explaining why BCG is the best strategy partner for IOCL lubricants.
For the report design – it has more of a magazine feel, where page layouts are closer to a leading magazine than a traditional report. BCG collaborating with IOCL encouraged the use of a combined colour palette of the two brands and allowed us to use distinctive black and blue overlays on photography, adding the perfect accent colors to a report design that feels true to both brands.
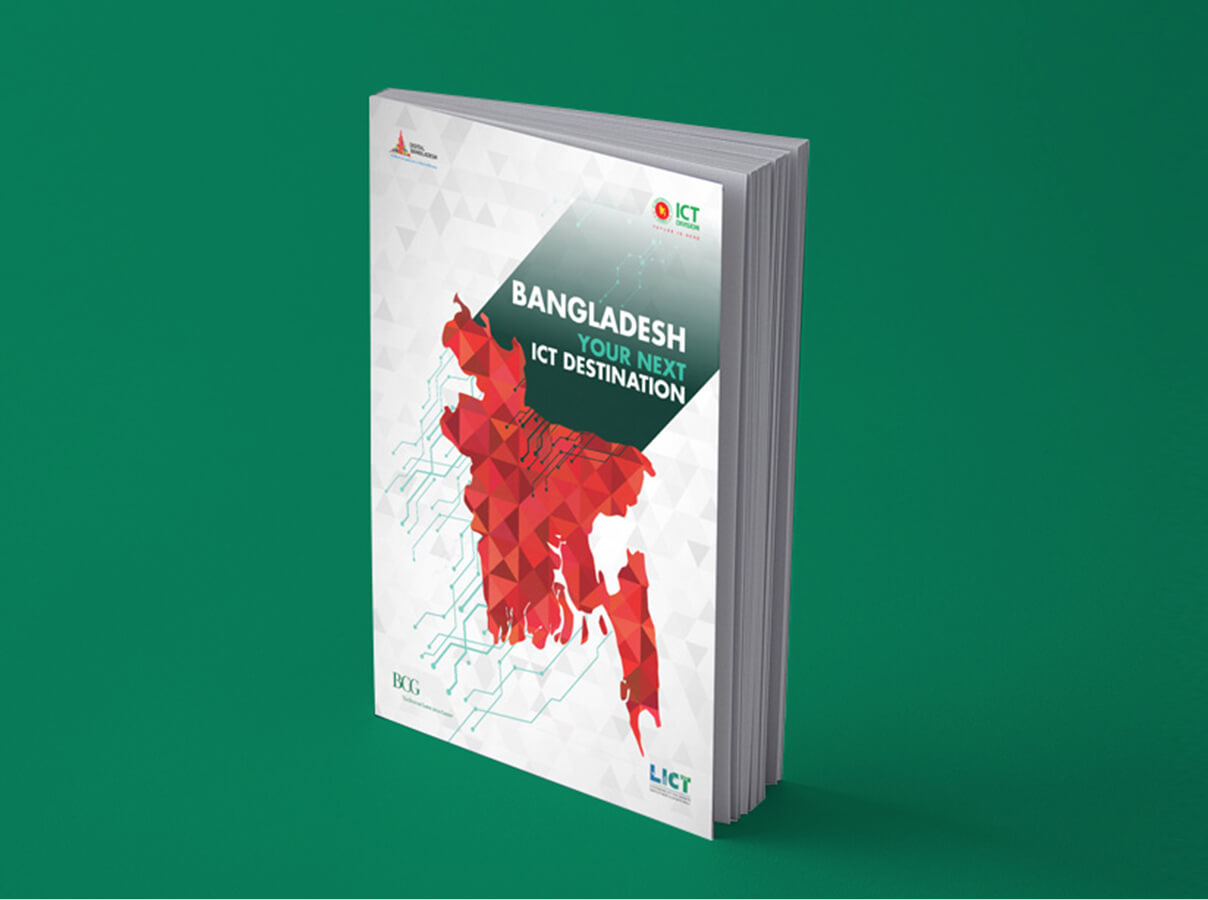
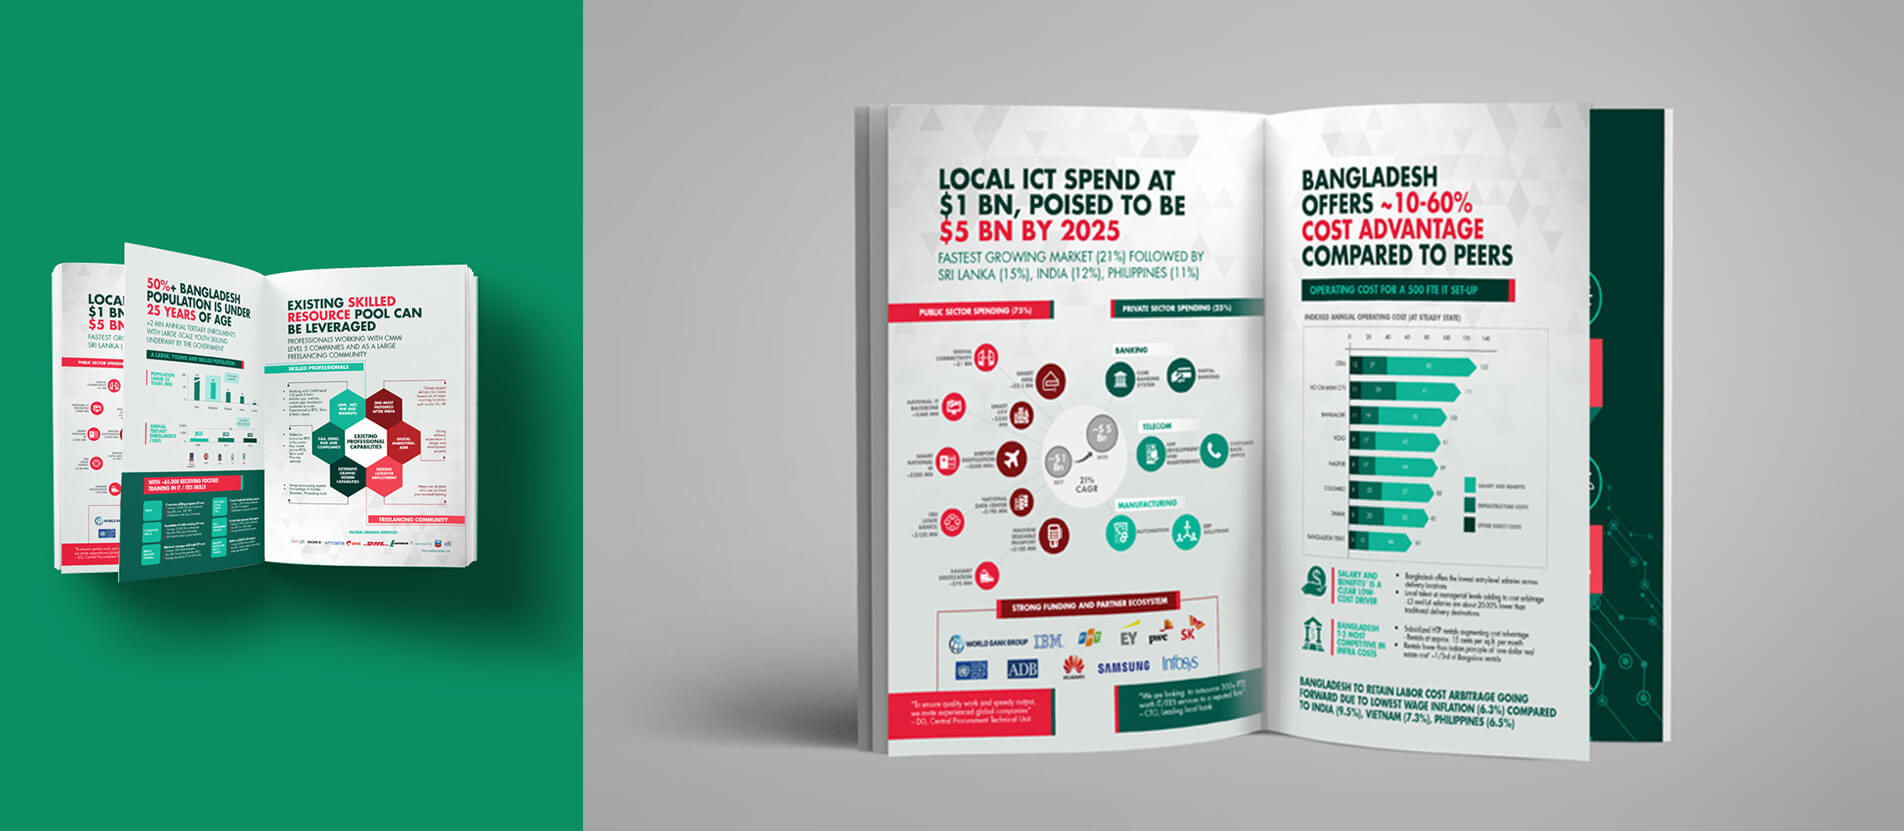
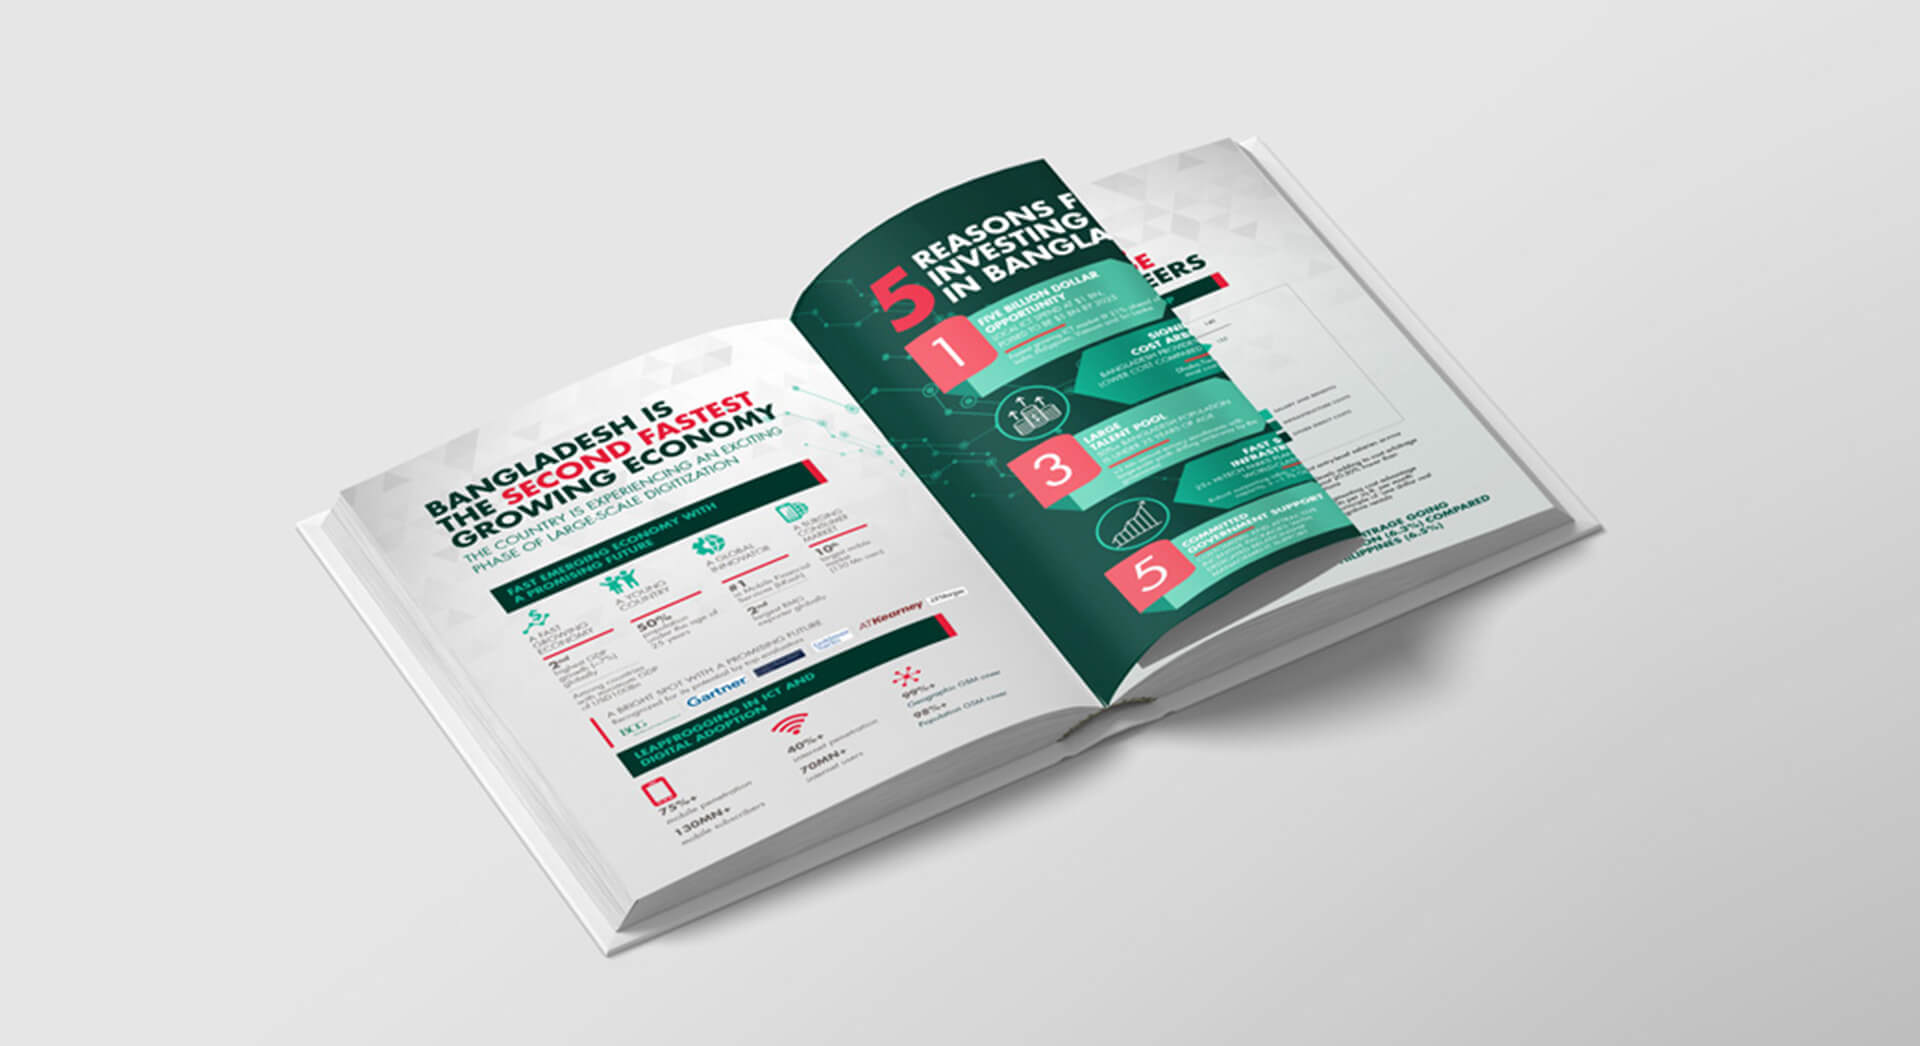
The world’s next ICT destination report
BCG partnered with the Information and Communication Technology Division of Bangladesh to create a forecast report. This 12-page report covered details ranging from the market opportunity for companies to measures and policies implemented by the government to support the industry.
To demonstrate all of this, we relied on impact infographics and smart charts on almost every page. To allow readers to focus on the information, we kept the design of the infographics simple and pared down. We kept use of colour to a minimum, but maximised it to help break up content within the infographic.